How to Use Chart Wizard
You can use Chart Wizard to choose chart type, set chart appearance, add chart title, show chart legend, and other settings.
- To start the Chart Wizard, in the Task Analytics Chart view, on the ribbon, in the View group, click Chart Wizard.
Tip Learn how to use Task Analytics Chart.
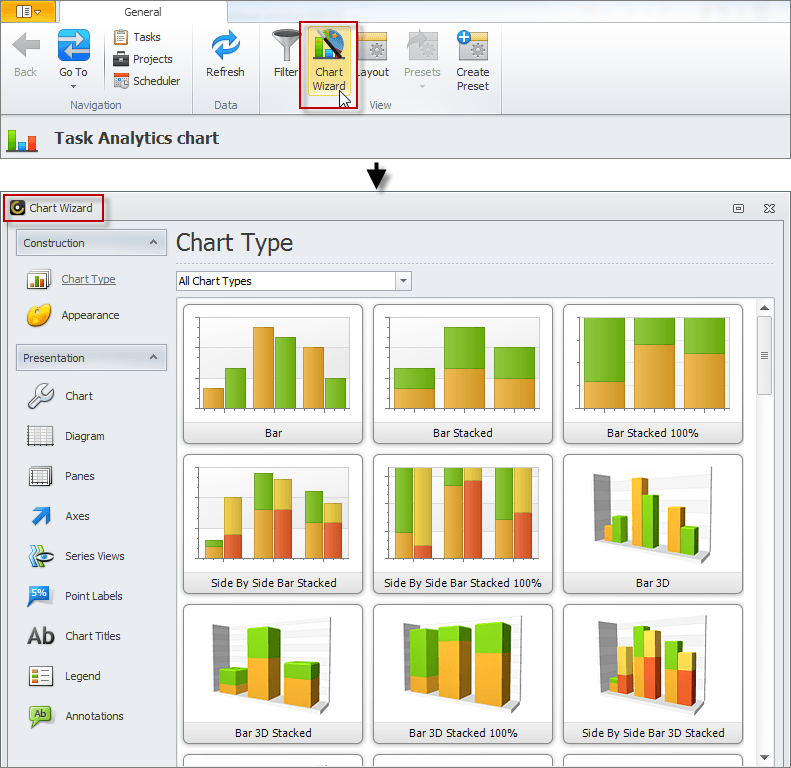
There are two groups of options in the Chart Wizard for designing charts: Construction and Presentation.
Construction
The Chart Wizard offers a variety of chart types you can choose for construction of charts that better show your analytics data.
Chart Types
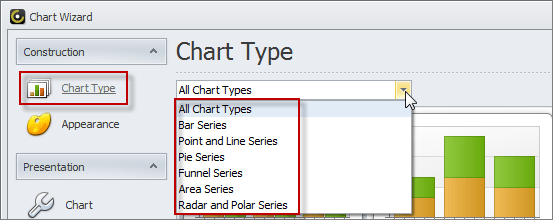
Chart types in the Chart Wizard are grouped into the following six series:
- Bar Series
- Point and Line Series
- Pie Series
- Funnel Series
- Area Series
- Radar and Polar Series
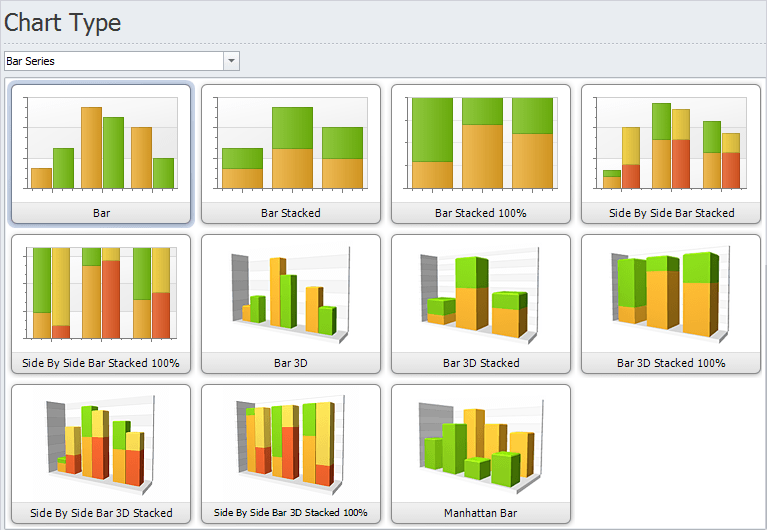
Bar Series
The Bar Series includes the following charts:
- Bar
- Bar Staked
- Bar Stacked 100%
- Side by Side Bar Stacked
- Side by Side Bar Stacked 100%
- Bar 3D
- Bar 3D Stacked
- Bar 3D Stacked 100%
- Side by Side 3D Stacked
- Side by Side 3D Stacked 100%
- Manhattan Bar
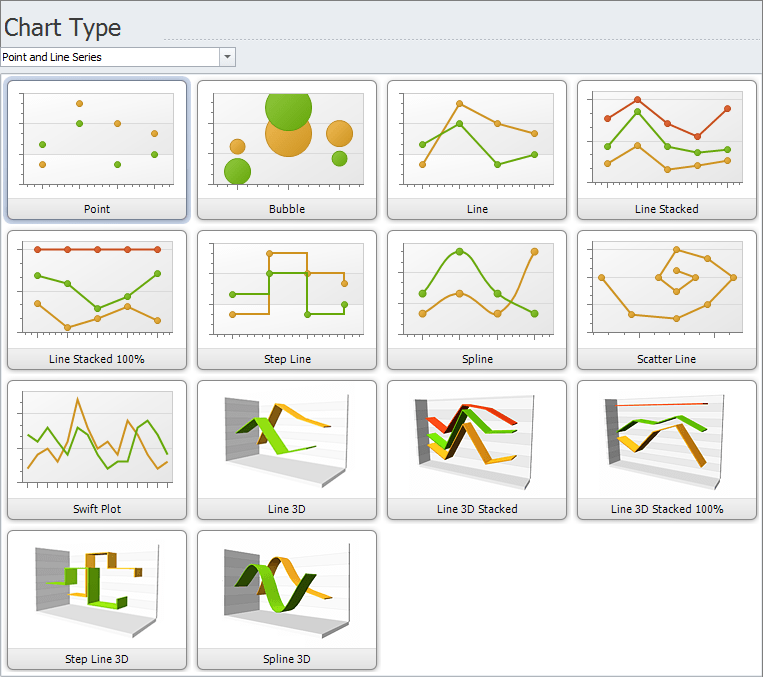
Point and Line Series
The Point and Line Series includes the following charts:
- Point
- Bubble
- Line
- Line Stacked
- Line Stacked 100%
- Step Line
- Spline
- Scatter Line
- Swift Plot
- Line 3D
- Line 3D Stacked
- Line 3D Stacked 100%
- Step Line 3D
- Spline 3D
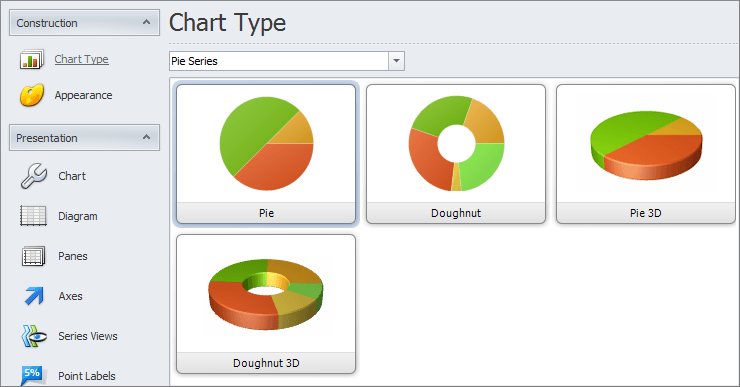
Pie Series
The Pie Series includes the following charts:
- Pie
- Doughnut
- Pie 3D
- Doughnut 3D
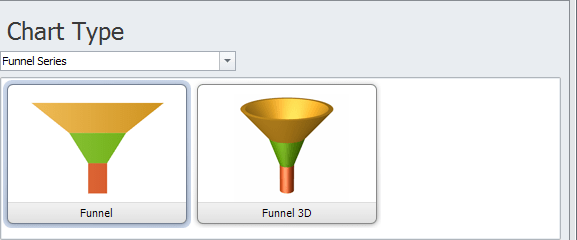
Funnel Series
The Funnel Series includes the following charts:
- Funnel
- Funnel 3D
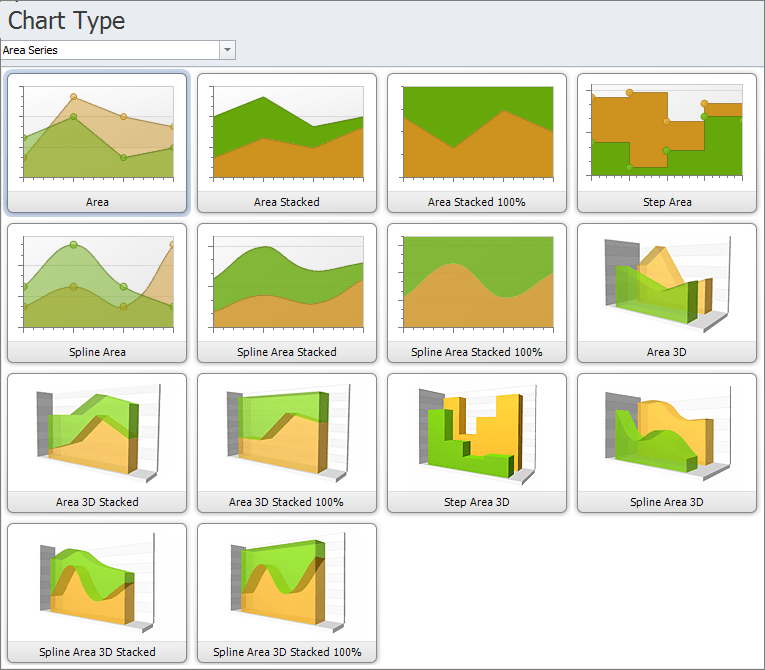
Area Series
The Area Series includes the following charts:
- Area
- Area Stacked
- Area Stacked 100%
- Step Area
- Spline Area
- Spline Area Stacked
- Spline Area Stacked 100%
- Area 3D
- Area 3D Stacked
- Area 3D Stacked 100%
- Step Area 3D
- Spline Area 3D
- Spline Area 3D Stacked
- Spline Area 3D Stacked 100%
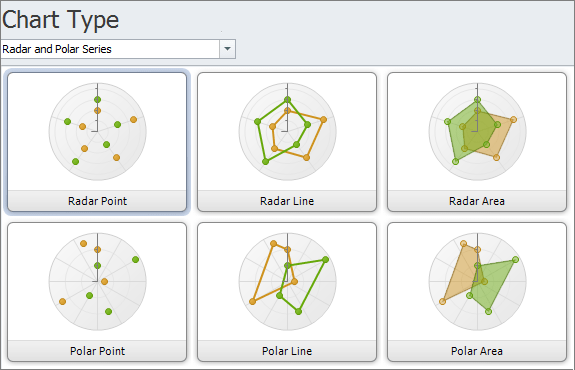
Radar and Polar Series
The Radar and Polar Series includes the following charts:
- Radar Point
- Radar Line
- Radar Area
- Polar Point
- Polar Line
- Polar Area
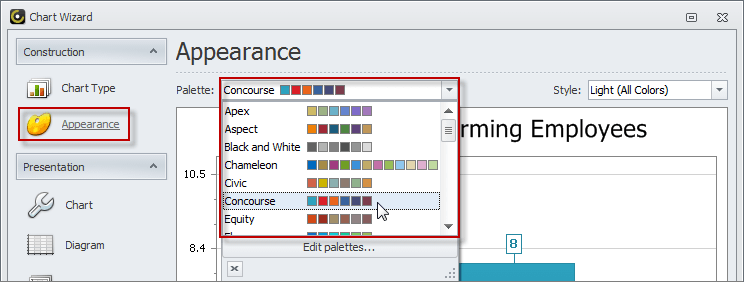
Appearance
You can change the default color palette and style of the chart.
- To change color palette, click Appearance, click the down-pointing arrow in the Palette box, and then click required palette.
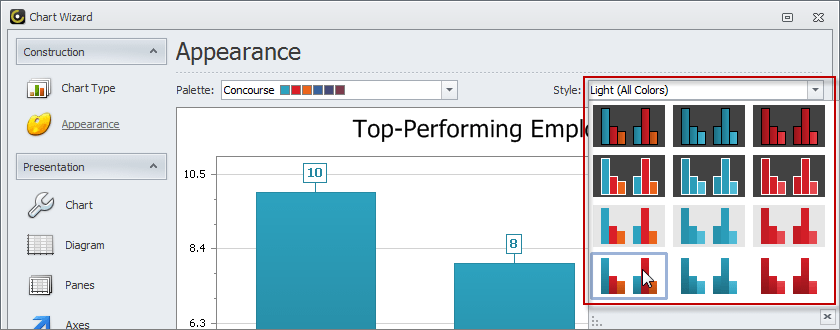
- To change style, click Appearance, click the down-pointing arrow in the Style box, and then click required style.
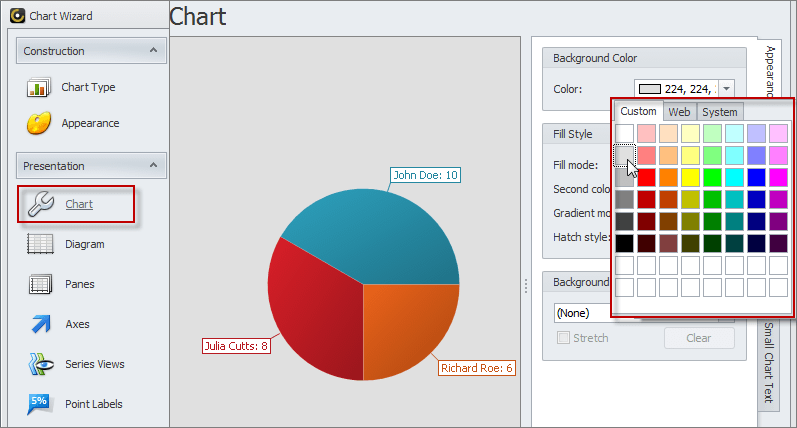
Presentation
The Chart Wizard offers various options for chart presentation, such as color, diagram, panes, axes, point labels, and legend.
Chart
You can select background color and style, add background image, show or hide chart borders, select color and thickness of chart borders, set padding, and specify text to show when chart is empty or too small.
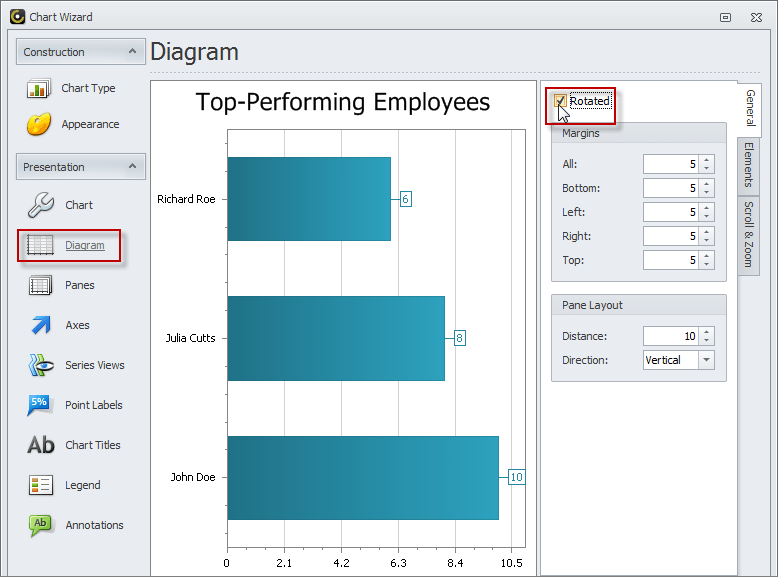
Diagram
You can rotate diagrams, set diagram margins, specify diagram dimension, choose horizontal or vertical direction, add X-Axes and Y-Axes, add panes and set their layout, enable or disable scrolling, etc.
Panes
You can make panes visible or invisible, set pane size, appearance, border, shadow, scrolling and zooming options, etc.

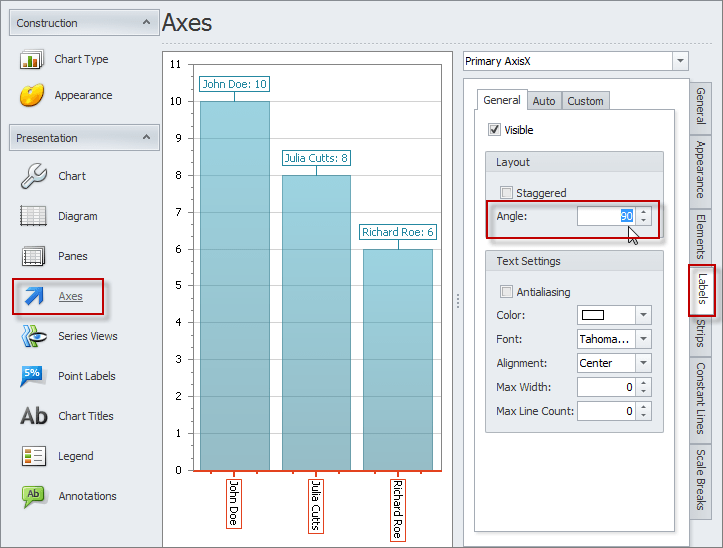
Axes
You can make axes visible or invisible, position axes, choose axes color, change axes title, tickmarks, and grid lines settings, show or hide axes labels, add axes strips, constant lines, and scale breaks.
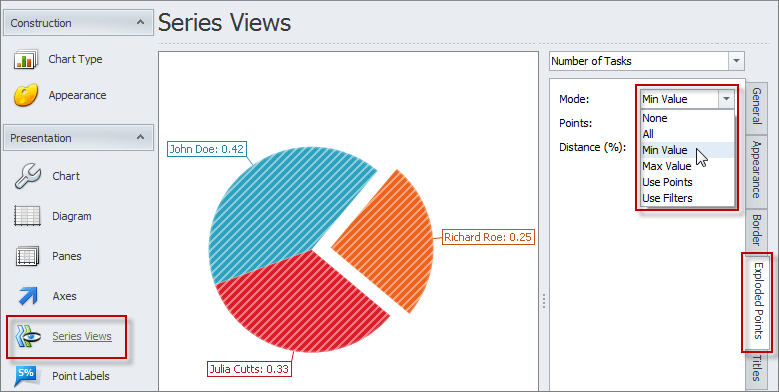
Series Views
You can set series width and distance, choose series color, add indicators, make borders visible or invisible, show or hide shadow, and change other settings.
Point Labels
You can make point labels visible or invisible, change point labels position and orientation, set color of point labels text, background, and lines, show or hide point labels borders and shadow.
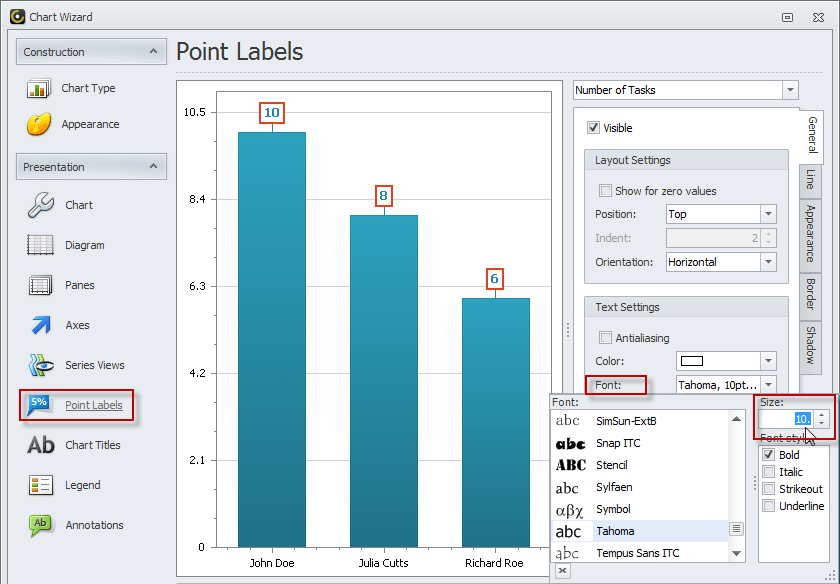
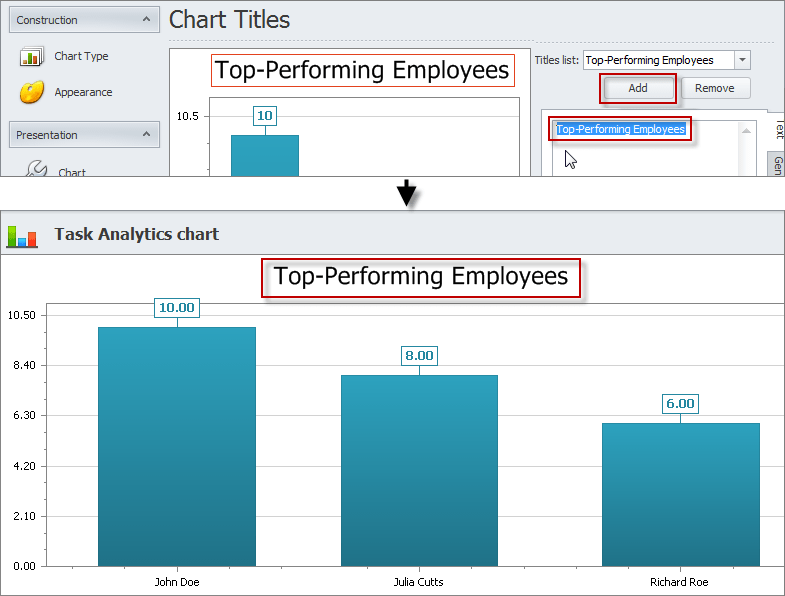
Chart Titles
You can add chart titles, make titles visible or invisible, position titles, choose titles font and color.
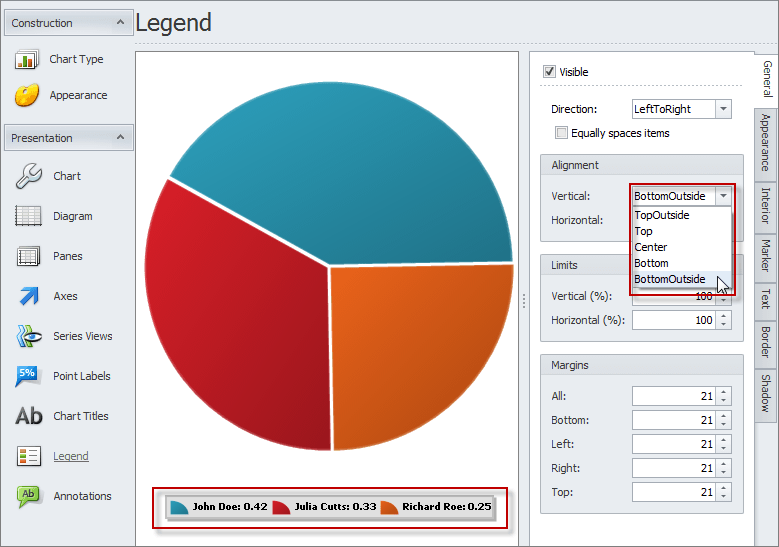
Legend
You can make chart legend visible or invisible, set legend direction, alignment, limits, and margins, choose legend background color, fill style, and image, change settings of legend interior, marker, text, border and shadow.
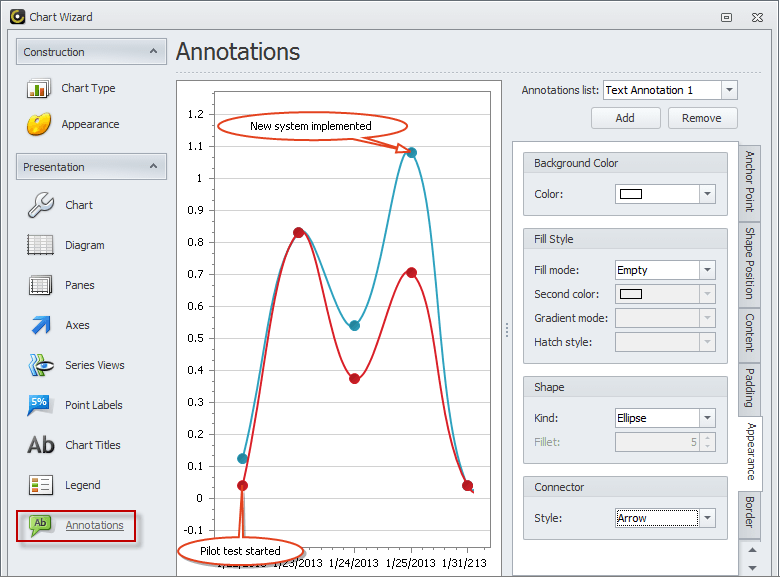
Annotations
You can add chart annotations, anchor annotations to chart or its elements, change settings of annotation shape position, content, padding, appearance, borders, and shadow.