How to Create a dashboard
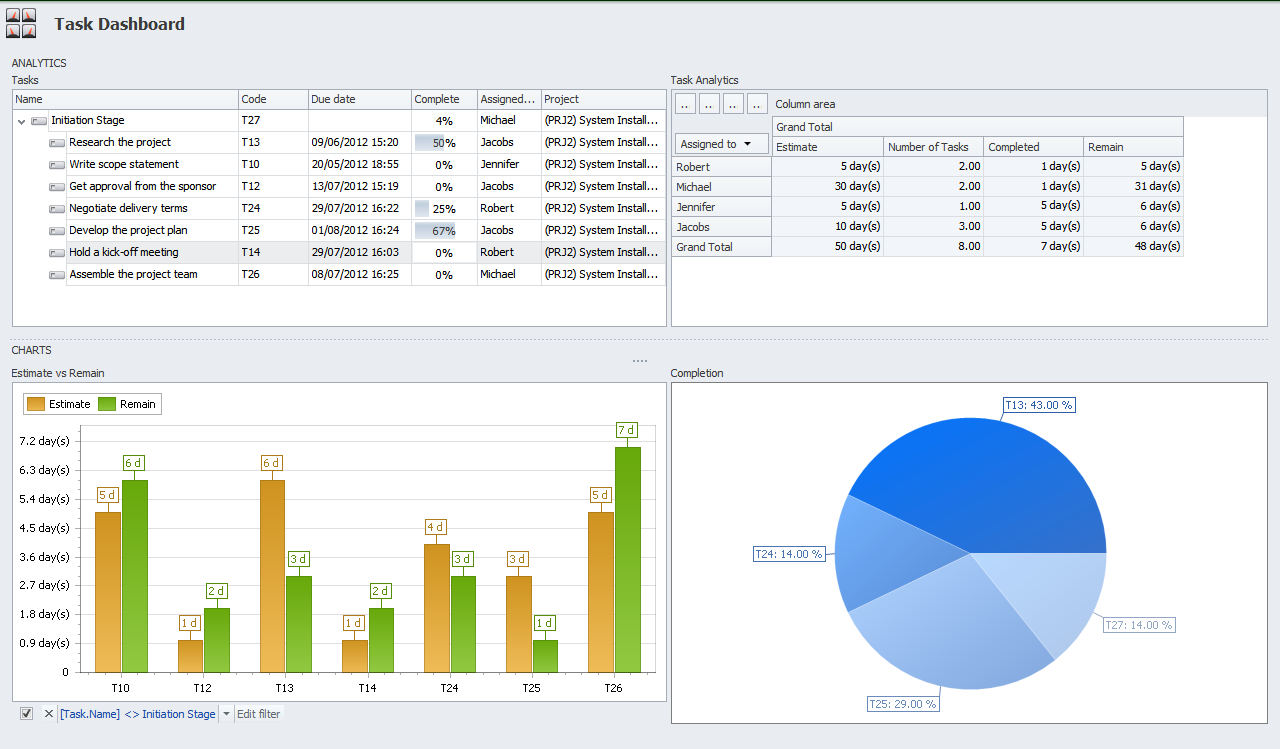
Dashboard view can contain multiple views. For example, task-related dashboard can show the Tasks view, the Task Analytics view, and the Task Analytics Charts view.
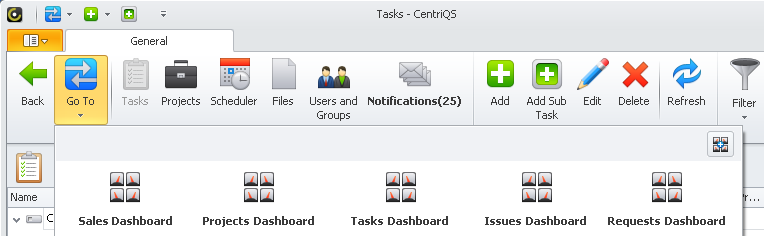
You can create multiple dashboards related to various data.
To create a new dashboard
1. Click the Application Menu, and then click Create Dashboard.
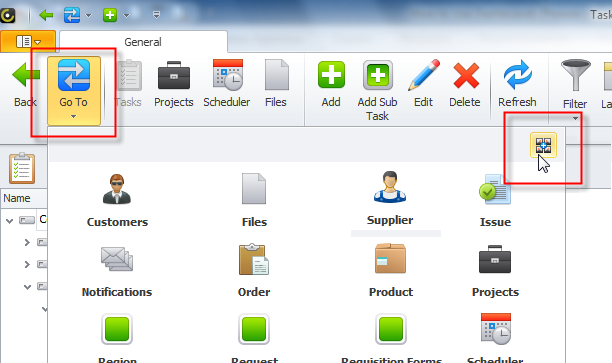
Tip Alternatively, you can click Go To, and then click Create Dashboard (the button in the upper-right corner).
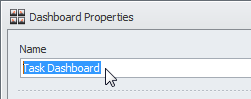
2. In the Name box of the Dashboard Properties dialog box, enter the name of the new dashboard.
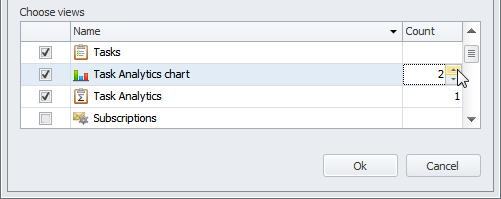
3. In the Choose Views list of the Dashboard Properties dialog box, select the check boxes next to the views you want to display on your dashboard, and then click OK.
Note You can display several instances of Analytics and Analytics Chart view in one dashboard.
To set the new dashboard layout
1. On the ribbon, in the Data group, click Layout.
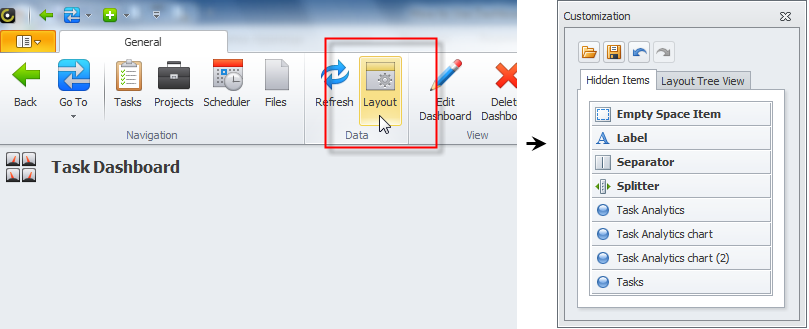
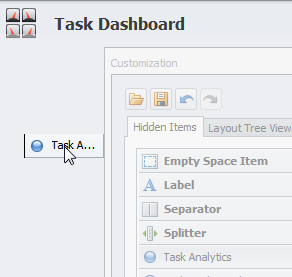
2. Drag required views and design elements from the Customization From dialog box to the dashboard area.
Note You can use the following design elements to set the dashboard layout:
- Empty Space - adds an empty space between two items on the dashboard
- Label - creates a title area
- Separator - adds a dotted line between two items
- Splitter - divides two items
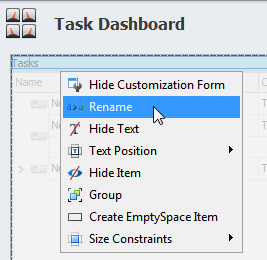
3. Right-click a view in the dashboard area and use the shortcut menu for customization.
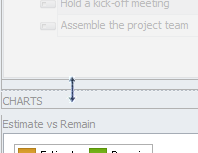
4. Drag the edges of the views to shrink or extend their size in the dashboard.
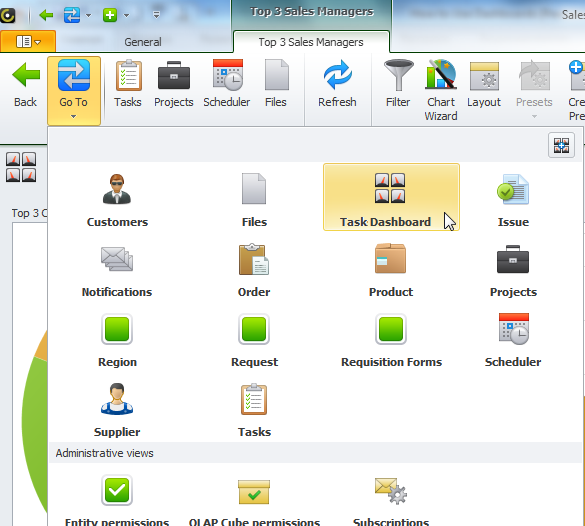
Note The new dashboard will become available in the list of views, when you click Go To on the ribbon.